Appendix O: Growth Charts
Kelly McKown
Growth Charts
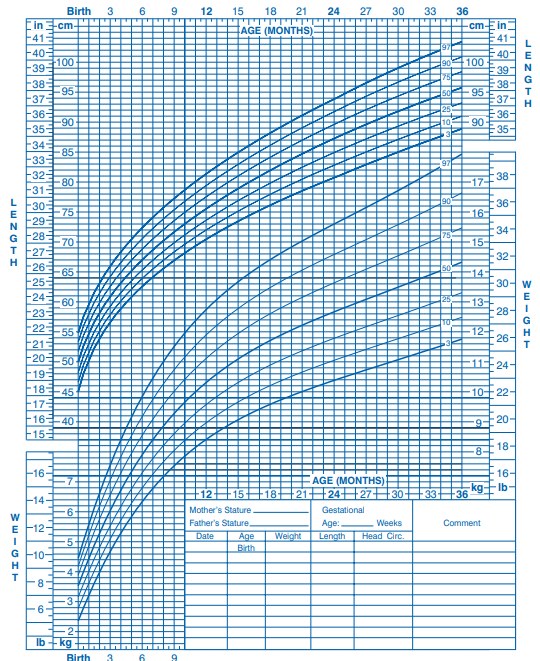
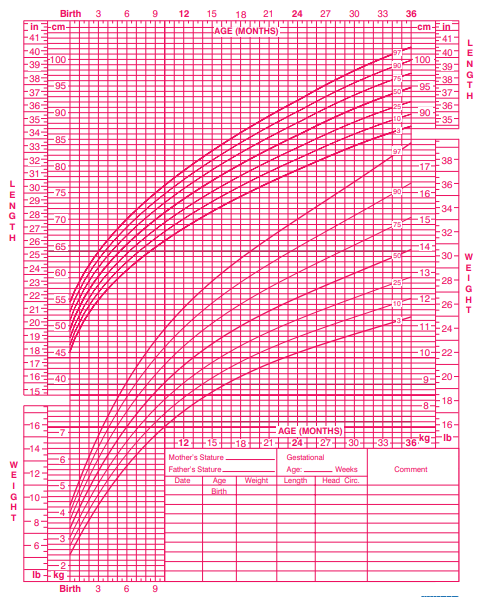
Birth to 36 months (3rd -97th percentile)
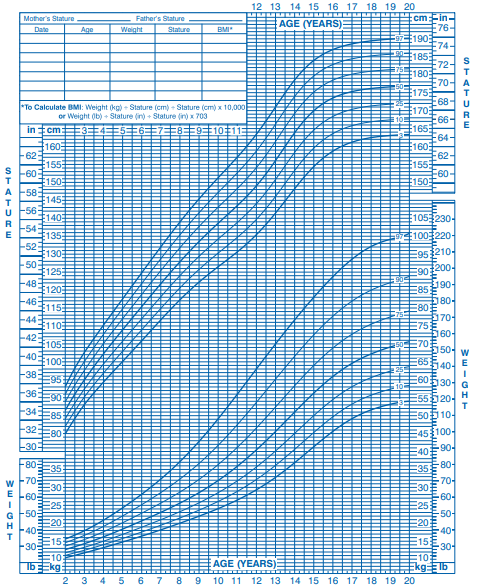
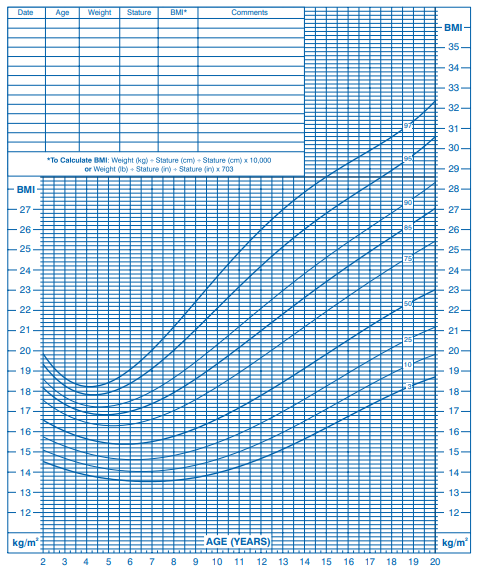
Children 2 to 20 years (3rd-97th percentile)
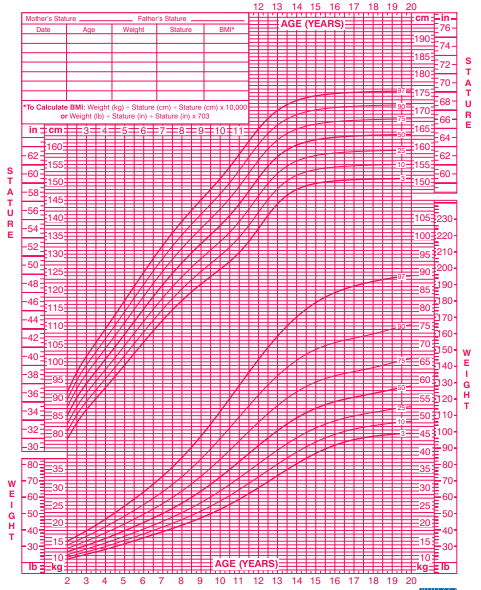
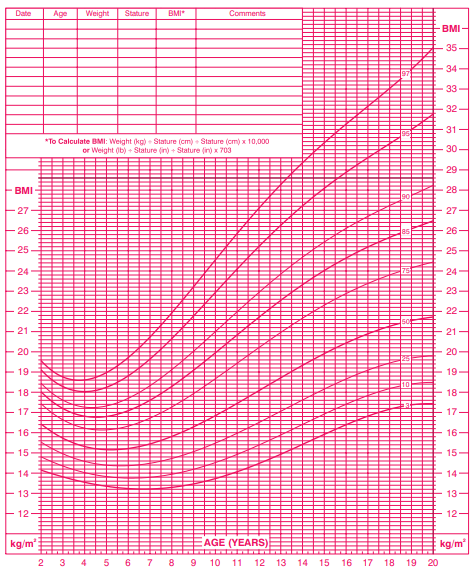
[1] Image by the National Center for Health Statistics in collaboration with the National Center for Chronic Disease Prevention and Health Promotion is in the public domain
[2] Image by the National Center for Health Statistics in collaboration with the National Center for Chronic Disease Prevention and Health Promotion is in the public domain
[3] Image by the National Center for Health Statistics in collaboration with the National Center for Chronic Disease Prevention and Health Promotion is in the public domain
[4] Image by the National Center for Health Statistics in collaboration with the National Center for Chronic Disease Prevention and Health Promotion is in the public domain
[5] Image by the National Center for Health Statistics in collaboration with the National Center for Chronic Disease Prevention and Health Promotion is in the public domain
[6] Image by the National Center for Health Statistics in collaboration with the National Center for Chronic Disease Prevention and Health Promotion is in the public domain
